Meteorological Survey of Mars: 1965 -
1995
By: JEFFREY D. BEISH
Association of Lunar and Planetary
Observers (A.L.P.O.)
ABSTRACT: The fourth is a series of
A.L.P.O. Mars reports presenting results of a computerized
statistical analysis of the meteorology of Mars. Using
computer programs developed for analysis of the Martian
environmental and climatic surveys, an extensive statistical
evaluation of fourteen apparitions is presented. A
statistical analysis for past meteorological activities for
clouds, bright surface frosts, and dust clouds are shown by
general table of percentage of occurrence sub-divided in
seasonal intervals and averaged over fourteen
apparitions.
Starting with the 1964-65
Apparition of Mars, the International Mars Patrol (I.M.P.)
began a systematic observing program designed to record all
meteorological activity on Mars using pre-selected colored
filters and observing techniques developed by the well known
Mars authority Charles F. (Chick) Capen, Senior A.L.P.O. Mars
Recorder. A continuation of the systematic ground-based support
for Mars studies represents fifteen apparitions of study. The
I.M.P. coordinated the efforts of 1,074 astronomers located the
United States and 44 foreign countries interested in detailed
study of the planet Mars organized for a 24-hour surveillance
program of the planet during each apparition. The I.M.P. is the
primary observing program for the Mars Section of the
Association of Lunar and Planetary Observers
(A.L.P.O.).
The I.M.P. archives contain
26,161 observations of Mars to date. A catalog of 24,130
observations of Mars has been used for this survey. This paper
presents statistical analyses from the wealth of data obtained
during the 31-year period from 1964 through 1995 for
investigating seasonal and long-term patterns in the Martian
meteorology and climate.
Part-I of the Meteorology of
Mars report series briefly described methods used in the
analysis and presented detailed results of the 1981-82 Martian
Environmental and Climatic Survey, [Beish et
al, 1986]. Information pertaining to part one was obtained
from observations of the Institute for Planetary Research
Observatories (I.P.R.O.). Further analysis using data from the
Association of Lunar and Planetary Observers (A.L.P.O.) Mars
Section observation records were presented in Meteorology of
Mars Parts-II, [Beish et al, 1987], and
Part-III, [Beish et al, 1987].
A complete systematic survey of
I.M.P. observations of Mars resulted in publication of a more
detailed trend analysis of bright aerosols and condensates
reported by A.L.P.O./I.M.P. observers during 1968 throughout
1985 and was presented to the American Geophysical Union
[Beish and Parker,
1990].
MARTIAN CLOUDS, HAZES, AND
WHITE AREAS
Clouds, hazes, and white surface
areas are observed on Mars during every Martian season.
Observational records indicate that these bright features
exhibit certain characteristics similar to the familiar
terrestrial clouds, fog’s and hazes. They are especially bright
in blue light and are sometimes observed to brighten in all
colors. From these observations and from the data gathered by
the Mariner spacecraft and the Viking Landers/Orbiters, we now
know that H2O ice clouds and CO2 hazes do
exist on Mars. We should feel comfortable with the idea that
what we observe as bright patches from Earth are clouds and
hazes on Mars. Our Earth-based telescopic observations are more
significant with this new knowledge [Capen,
1982]
Martian clouds, fogs, frost, and dust
clouds come in various shapes and sizes and are sometimes
observed to move around on the planet blocking out portions of
the surface. We were particularly interested in their locations
and movements, and their seasonal counts. Various methods have
been employed to enhance these bright areas, one of which is
the use of colored transmission filters. These filters are
regularly used by I.M.P. observers for visual and photographic
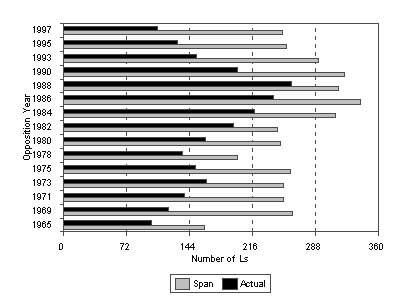
observations of Mars and other planets [Capen, 1982]. Table 1 and Figure 1 are general
histograms of the observational coverage during each Mars
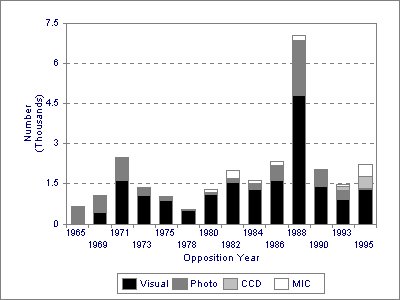
apparition used in this study. Figure 2 plots the number of
visual, photographic, micrometric, and CCD images observations
contributed during each opposition year.
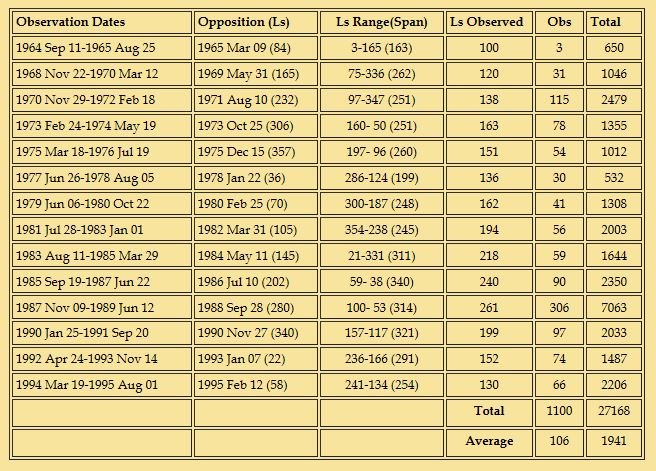
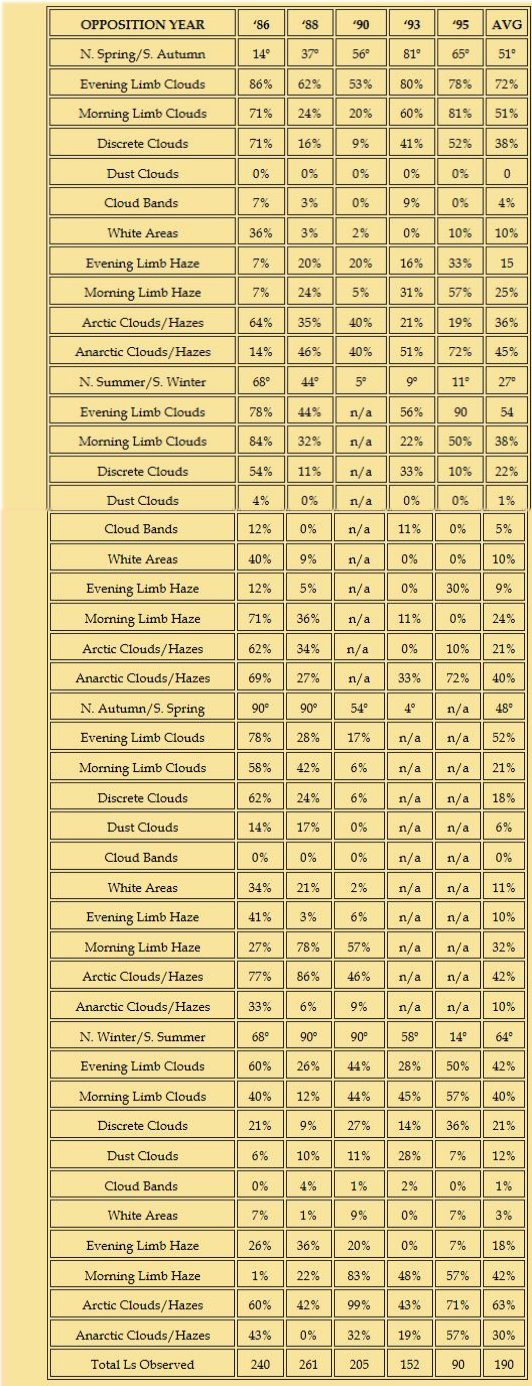
Table I. History of ALPO/IMP
observations from 1965 through 1993. Given are the dates
from the first to last observations, the opposition date
and Planetocentric of the Sun (Ls), Ls range, total span
of Ls from first top last observation, actual number of
Ls observed, number of observers (OBS), and total
observations (Visual, Photographic, Micrometer, and
CCD).
RARELY OBSERVED CLOUD
BANDS
Rarely observed are the
Planetary System Cloud Banding or Equatorial Cloud Band (ECB)
ECBs appear as broad and diffuse hazy streaks usually observed
crossing within ±20 degrees of the Martian equatorial zone.
Cloud bands are detected visually using a deep blue (W47B) or
violet (W47) filter or photographed in ultraviolet or violet
light. Cloud bands are probably composed of thin CO2 ice
crystals carried aloft by high altitude winds.
Until recently, cloud bands were
most often observed during the Martian northern summer,
however, systematic tricolor CCD imaging has uncovered evidence
these wisps of cloud bands may be more frequent and may occur
in all Martian seasons. Using a special Infrared blocking
filter in conjunction with high quality glass Wratten red,
green, and blue filters these ECBs are readily detected and may
be unseen by visual observers.
The I.M.P. has initiated an
observing program for intensive investigation into these
phenomena and will appeal to all planetary observers using CCD
technology to assist us in this important study.
Figure 1. Graph of observational
coverage during Mars apparitions as indicated by the
corresponding opposition year. Graph includes number of
degrees Ls span form first to last observation and number
of degrees Ls covered by actual observational
reports.
Each of the 24,130 Mars
drawings, photographs, CCD images in the ALPO Mars Section
Observational Report Library was carefully evaluated for
quality and accuracy, with special attention given to proper
use of color filters. When multiple observations of a
particular phenomena was evident, its precise size, shape, and
location was computed using the least squares method. To reduce
systematic errors, the "personal equation" for each
participating observer was derived from this computation and
used to quantify their experience.
Systematic errors are also found in our
data as a result of the nature of the reporting of Mars
observations. We might think of these observations as discrete
samples of time or "snap shots" of the conditions on
Mars. This is due to the fact we cannot possibly record every
moment of Mars’ history, even with the excellent longitudinal
coverage provided to us by our world wide network of observers.
Large gaps in areographic longitudes go unseen. To identify
simultaneous observations of clouds or white areas seen by
several astronomers is much less difficult than to separate
limb phenomena. This is because limb hazes and clouds appear to
stick close to the limbs and other phenomena rotate with the
planet, as if these clouds are continuously being created and
destroyed.
Figure 2. Bar graph showing number of
observations by type, i.e., visual drawing reports,
photographs, micrometer measurements, and CCD images.
In performing this study we have made every
effort to reduce systematic errors. The least square method was
employed to construct each individual observer’s personal error
equation. Each observer’s experience and reliability, type and
size telescope used, reported atmospheric "seeing"
conditions, and general location was considered carefully when
selecting observations for the survey.
Whenever available, photographs
were utilized to cross check and confirm phenomena reported
visually. Nevertheless, owing to the orbital geometry of Earth
and Mars and Mars’ axial tilt, considerable bias is
unavoidable. For example, the sub-earth point (De) can be
situated more than 25° from Mars’ equator for much of an
apparition. This prohibits observations of those regions near
the hidden pole. Areas from latitudes of 50° and more are
sometimes hidden as are the back side Mars and terminator
areas. All these lost observations go into the "bucket of
the unknown." Other sources of bias include the greatly
varying distance of Mars from the Earth (changing Mars’
apparent size by some 4-5 times), the period near conjunction
with the Sun, when Mars cannot be observed at all or only
briefly each night, and the changing value and position of the
phase angle that complicates observations of hazes and clouds
near Mars’ poles, limbs, and terminator. These problems are
real but uncontrollable, since we cannot yet change our vantage
point and must remain earthbound.
Statistical analysis was carried
out using a 486DX2-50 Express Business Computer and
Gateway-2000 4DX2-66 Business Computer. Graphics plots
presented here has been the product of Borland’s Quattro Pro
version 5.0.
The tables in this report are
simple percentages of the frequency with which we observe the
various types of meteorological phenomena on Mars. Owing to a
small difference in axial tilt, Mars’ seasonal periods are
similar to those of Earth. When observing Mars from Earth, we
see both the planet’s northern and southern hemispheres, so we
must specify that hemisphere’s season and is indicated on each
graph and table.
Due to the longer year and
higher eccentricity of the Martian orbit, the seasons on Mars
are not as symmetrical as Earth’s. The Martian northern spring
and summer are longer than autumn and winter, (reversed for the
Southern Hemisphere).
For statistical analyses,
percentages are generally based on the number of activities of
weather phenomena observed during seasonal periods versus the
actual time spent observing Mars during that particular season.
The Martian year of four seasons start with its vernal equinox
at 0° planetocentric longitude (Ls) and moves eastward in its
orbit through the seasons. Martian seasons are defined as:
spring (0° - 89° Ls), summer (90° - 179° Ls), autumn (180° -
269° Ls), and winter (270° - 359° Ls). For this study, the
Martian year is subdivided into 90° periods, measured in
degrees of Areocentric or planetocentric longitude of the Sun
(Ls); and the terms "Nsp/Sau," "Nsu/Wwi,"
"Nau/Wsp," and "Nwi/Ssp" corresponds
respectively to "spring," "summer,"
"autumn," and "winter" that identifies with
the Martian seasons in each of the planet’s
hemispheres.
To provide a valid and
systematic distribution of the observational data, I chose to
(1) discard those observations made when Mars was less than 6
arcsec apparent diameter, (2) exclude seasonal periods with
less than 12% observational coverage, and (3) eliminate
observations by very inexperienced or novice planetary
astronomers. These three criteria confine analysis to at least
much of each Martian season occurring immediately before and
after opposition and to observations made by experienced
planetary astronomers.
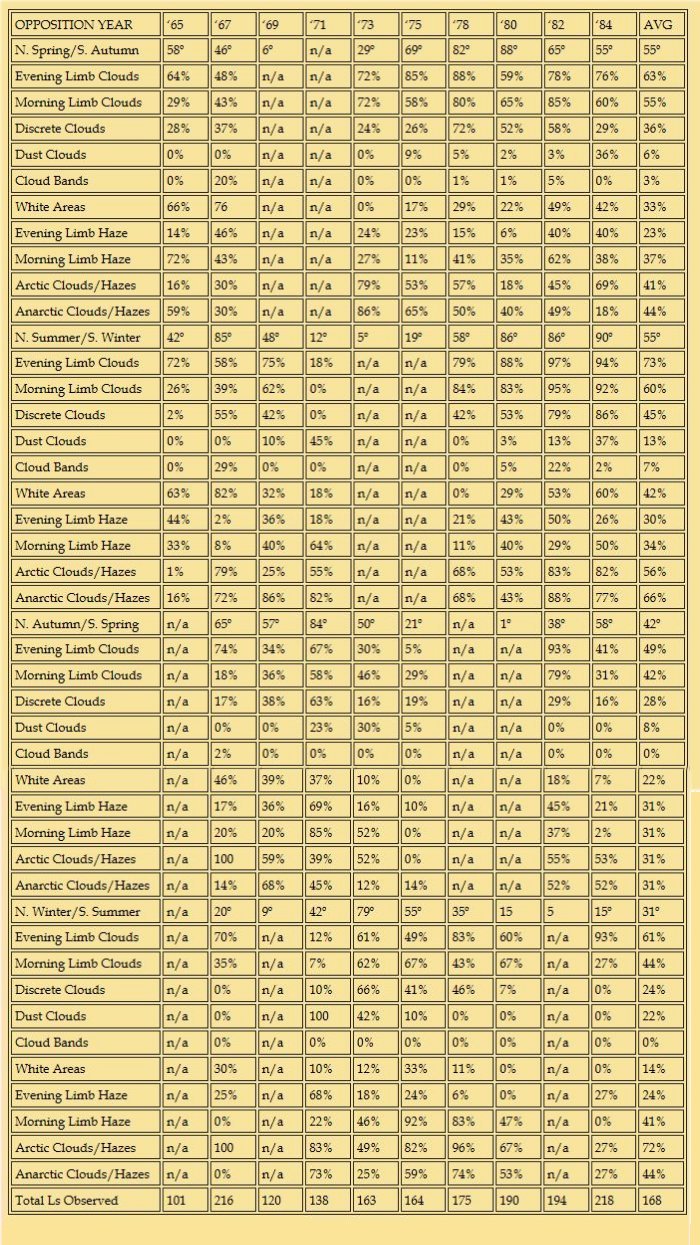
Table II and III summarize the
results of our statistical analysis for each phenomenon by
season. Although our knowledge of "white areas" is
limited, their characteristics suggest they are surface
deposits of frosts. I have included white areas in this survey
because these phenomena may prove to be both surface and
atmospheric in nature. Also, bright areas have been observed
immediately after dust storm activity further suggesting
surface deposits of fresh dust.
Figure 3 represent a more detailed
breakdown for each type of meteorology by season and include
the north-south hemisphere occurrences as well. In each case,
the percentages reflect the number of activities versus the
number of degrees Ls observed for each period.
Table II. Martian Meteorological Survey,
1965 - 1984. Given are the apparition years, Ls (degrees)
actually observed during an apparition, and seasonal
percentages of meteorology observed.
Table III. Martian Meteorological Survey,
1986 - 1993. Given are the apparition years, Ls (degrees)
actually observed during an apparition, and seasonal
percentages of meteorology observed.
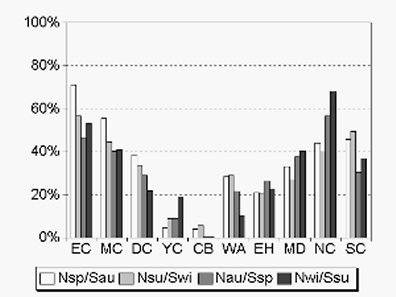
Figure 3. Graph indicating the overall
simple average meteorological active degrees Ls during all
apparitions from 1964 through 1993. Each type of
meteorology in listed in the vertical scale and percentage
of the observed Martian year is indicated in the horizontal
axis. The terms Nsp/Sau = Northern spring/Southern autumn,
Nsu/Swi = N. spring/S. winter, Nau/Ssp = N. autumn/S.
sprint, and Nwi/Ssu = N. winter/S. summer.
One striking finding of this
study is the marked proclivity for limb clouds and discrete
clouds to appear during northern hemisphere spring and summer.
This seasonal preference may result from different composition
of the polar caps. Viking data has shown that many of the white
limb and discrete clouds are composed of water-ice crystals.
The Viking spacecraft have demonstrated that the primary
composition of the South Polar Cap (SPC) is carbon dioxide ice
(CO2 ) with perhaps a tiny core of water ice clathrate
[James et al., 1979], while the North Cap
consists of a layer of carbon dioxide covering a fairly large
water-ice remnant [Kieffer et al., 1976]. The
frequency distribution of these clouds appears to follow the
regression of the north cap, increasing as the remnant cap is
exposed during Martian northern summer.
The much lower incidence of
white clouds during southern spring and summer agrees well with
Mars’ known asymmetry in water vapor abundance [Farmer and Doms, 1979; Jakosky and Farmer, 1982]. It should
be pointed out, however, that the apparitions most favorable
for studying these Martian seasons were 1971 and 1973, years of
global dust storm activity. During these two apparitions, dust
clouds obscured large areas of the planet throughout much of
the southern spring and summer, reducing the chances of
observing white clouds. While this has no doubt introduced some
bias, our preliminary reduction of the considerable data from
the 1986 and 1988 apparitions [Parker et al.,
1989] suggests that there is indeed much less discrete and limb
cloud activity in southern spring and summer than there is
during these seasons in the north. Even the orographic "W
clouds" in 1986 around 200°-220° Ls were neither so
numerous nor so long-lived that they would be able to alter the
dominance of the "more usual" northern spring/summer
meteorology in this survey. The 1988 apparition displayed even
fewer clouds, despite a record number of experienced observers
participating in the meteorological survey. As the data from
1986, 1988, 1990, and 1993 is added to this study, any bias due
to global storms have been reduced considerably.
A short-term climatic phase of
this survey is being completed. Although the seasonal coverage
is incomplete for 1971 and 1973 (due to global dust storms)
enough data was available to qualify the survey under the above
12% criterion. I have also included data from C.F. Capen’s
observational records and photographic library for the 1964-65
and 1966-67 apparitions and further reducing the data from the
1962-63 apparition observations and photographs by C.F.
Capen. Despite the resultant gaps in the coverage,
meteorological observations of the 1960s are considered
credible, since C.F. Capen, who organized this survey,
performed most of the work at Table Mountain
Observatory.
As a result of this survey this
author will not rule out the possibility of short-term and
highly variable climatic changes on Mars as predicted by past
I.M.P. studies and has published these suggestions before
[Parker et al, 1983]. On
the surface this meteorology study can be used in conjunction
with past studies of the Martian polar cap behavior indicates
the planet Mars was either cooler during the 1960’s and warmer
in the early 1980’s or the observing techniques and equipment
have so biased our results that we need to completely
revolutionize the art of observing the Solar System with more
objective methods.
The spacecraft missions to Mars
during the 1960’s and 1970’s have resulted in a new impetuous
for ground-based telescopic observing of the Red Planet.
Astronomers are now armed with new knowledge about Mars made
available by close-up surveillance by the Viking Orbiters and
Landers. Of course, the loss of Mars Observer has ended
prospects of continuing the close-up watch on Mars and all
those machines are just space junk now.
The benefits of the study of
Mars’ climate will help in the understanding of our own
planet’s climate. The methods arrived from the meteorological
survey of Mars using A.L.P.O. observations and modern
techniques will increase our knowledge of the planet Mars. The
amateur astronomer has earned a place in modern
science.
Beish, J.D., Parker, D.C., and Capen, C.D.,
"Meteorology of Mars - Part I," Journal
of the Association of Lunar and Planetary Observers
(J.A.L.P.O.), Vol.31, Nos. 11-12, November 1986.
Beish, J.D., Parker, D.C., and Capen, C.F.,
"Meteorology of Mars - Part II," J.A.L.P.O., Vol.32, Nos. 1-2, March 1987.
Beish, J.D. and Parker, D.C., "Meteorology
of Mars - Part III," J.A.L.P.O., Vol 32,
Nos. 5-6, October 1987.
Beish, J.D., and D.C. Parker, 1990.
"Meteorological Survey of Mars, 1968-1985," Journal of Geophysical Research (JGR), Vol. 95, B9,
14657-14675, August 20, 1990.
Capen, C.F. and D.C. Parker, "Observing Mars
IX - The 1981-82 Aphelic Apparition," J.A.L.P.O.,, Vol. 29, Nos. 5-6, April 1982
Capen, C.F., "International Mars Observation
Computer Program Studies of Seasonal Meteorological
Phenomena," an invited paper based data obtained on
computer programs and analysis of Martian meteorology by J.D.
Beish, D.C. Parker, and C.F. Capen. Commission 16
of the 18th General Assembly of the International Astronomical
Union (IAU). 19 August 1982.
James, P.B., G. Briggs, J. Barnes, and A. Spruck,
"Seasonal Recession of Mars’ South Polar Cap As Seen by
Viking," JGR, Vol. 84, No. B6, June
1979.
Kieffer, H.H., S.C. Chase, T.Z. Martin, E.D.
Miner, and F.D. Palluconi, "Martian North Pole Summer
Temperatures: Dirty Water Ice," Science,
Vol. 194, 1341- 1344, 1976.
Farmer, C.B., and P.E. Doms, "Global
Seasonal Variation of Water Vapor on Mars and the Implications
for Permafrost," JGR, Vol. 84,
2881-2888, 1979.
Jakosky, B.M., and C.B. Farmer, "The
Seasonal and Global Behavior of Water Vapor in the Mars
Atmosphere: Complete Global Results of the Viking Atmospheric
Water Detector Experiment," JGR, Vol.
87, 2999-3019, 1982.
Parker, D.C., J.D. Beish, and C.E. Hernandez,
"Mars’ Grand Finale." Sky and Telescope
Magazine, Vol. 77, No. 4. Pp. 369-372. April 1989.
Parker, D.C., C.F. Capen, and J.D. Beish,
"Exploring the Martian Arctic," Sky and
Telescope Magazine, Vol. 65, No. 3, March
1983.