In a four part series of A.L.P.O. Mars Section reports I presented results of a computerized statistical analysis of the meteorology of Mars (Beish et al, 1986 and 1987). Using computer programs developed for analysis of the Martian environmental and climatic surveys, an extensive statistical evaluation of fourteen apparitions was presented. A statistical analysis for past meteorological activities for clouds, bright surface frosts, and dust clouds are shown by general table of percentage of occurrence sub-divided in seasonal intervals and averaged over fourteen apparitions.
The statistical method discussed in this article was used in a paper Don Parker and I published in the Journal of Geophysical Research some years ago (Beish et al, 1990). Complex cyclical data can be used to forecast this trend analysis, or to plot a time series. The trend can be thought of as the average departure from the "mean."
From an interesting concept taken from an old college outline (Longley-Cook, 1970) I selected methods detailed in a chapter on "Time Series" to show the trends in observed cloud activity on Mars during a period from 1969 through 1985.
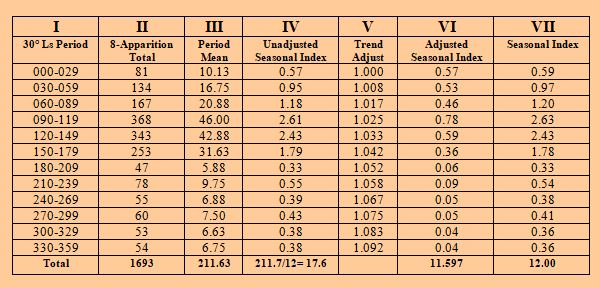
To calculate the Seasonal Index we first determine the tabular values from:
Column (I) is the 30 degree period or
sub-season.
Columns (II) total clouds counted during the 8 apparitions
for each period.
Column (III) is the Period Mean or average period found by
(II) / 8.
Column (IV) is the Unadjusted Seasonal Index or
(III) /
S (III).
Column (V) is the Adjusted Trend or [1 + monthly trend ( period – 1)].
Column (VI) is the Adjusted Seasonal Index Adjusted for
Trend.
Column (VII) is the Seasonal Index in Column (VII)
from (VI) * 12 /
S (VI)
NOTE: The monthly trend is found by dividing the annual trend by 12. The annual trend is determined by the average number of clouds from the first half (1969-1975) and second half (1978-1984) of the complete 8-years series.
From the external tables we determined the
period mean for number of clouds for the first half of the series
(1969-1975) was 8.2 and 27.0 for second half of the
series (1978-1984). So, the annual trend is (27.0 – 8.2) /
2 = 9.4. The monthly trend is: 9.4 / 12 = 0.783. We
find that the Adjust Trend (At) = [1 + 0.783 (period – 1)], where
"period" starts at integer 1 and increasing until end
of series (1, 2, 3……). This causes the mean "seasonal
index" for all 12 periods to equal 1. We find
S (III) / 12 = 211.7 / 12 = 17.6 and Column
(IV) from Column (III) /
S (III) / 12, then find Column (V) = [1 +
0.783 (period – 1)]. From (IV) / (V) we find the
Adjusted Seasonal Index in Column (VI).
Table 1. A typical set of twelve 30-degree Ls periods of recording the number of Martian discrete clouds observed from 1969 through 1984 by ALPO/IMP. The Martian year of four seasonal and 12 sub-seasonal periods start with its vernal equinox at 0° planetocentric longitude (Ls) and moves eastward in its orbit through the seasons or 360 degrees.
We can then produce a plot of the times
series trend line for discrete clouds observed on Mars during
eight apparitions and forecast an approximate number of clouds an
observer is likely to see in future apparitions for a particular
season. This study has been extended to include the 1965
apparition and the 1988, 1990, 1993, and 1995 apparitions. Using
the first study to test the second time series model it was
determined that a very close correlation exists between the two
studies (Beish, 1999).
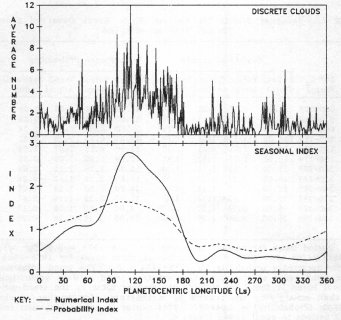
Plot 1. Two-part plot of Martian discrete clouds of the average number and trend-adjusted seasonal indices from 1969 through 1985. Top plot represents the average number of clouds observed per degree Ls. Bottom plot gives the seasonal indices for the number of clouds observed. A probability index (dashed line) was derived from additional information and tables based on the number of clouds seen per degree Ls by more than one observer.
References
Longley-Cook, L.H., Statistical Problems and How to Solve Them, Barnes and Nobles, New York, 1970.
Beish, J.D., Parker, D.C., and Capen, C.F., "Meteorology of Mars - Part I," Journal of the Association of Lunar and Planetary Observers (J.A.L.P.O.), Vol.31, Nos. 11-12, November 1986.
Beish, J.D., Parker, D.C., and Capen, C.F., "Meteorology of Mars - Part II," J.A.L.P.O., Vol.32, Nos. 1-2, March 1987.
Beish, J.D. and Parker, D.C., "Meteorology of Mars - Part III," J.A.L.P.O., Vol 32, Nos. 5-6, October 1987.
Beish, J.D., and D.C. Parker, "Meteorological Survey of Mars, 1968-1985," Journal of Geophysical Research (JGR), Vol. 95, B9, 14657-14675, August 20, 1990.
Beish, J.D., "Meteorological Survey of Mars For Opposition Years 1965 – 1995," The ALPO Internet Web Page: The Digital Lens, November 1999. http://www.m2c3.com/alpocs/tdl1999/meterological110199/MOM.html