Discussed in this article will be the method of using a Ron Darbinian Bi-Filar micrometer (See Figure M3-1 ) at the telescope and reduction of this data to a useable form. Also, using digital images and image processing software to analyze these images and to refine the polar cap measurements that reduces systematic errors is presented. The separation is read from the micrometer thimble and spindle and noted in either in millimeters.
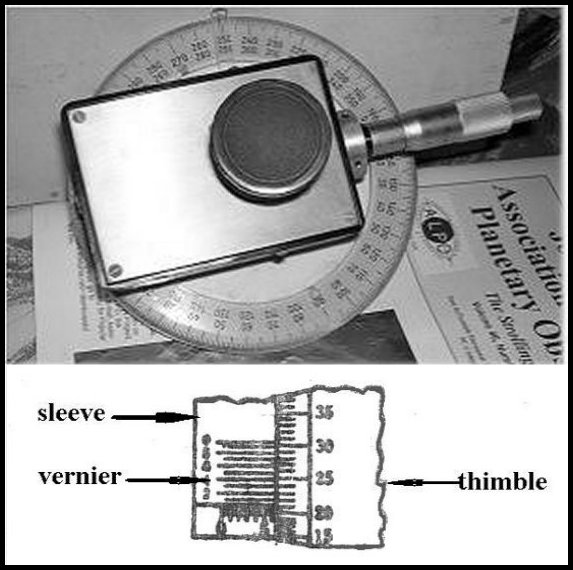
Figure M3-1. TOP: A Bi-Filar Micrometer produced by Ron Darbinian. It was sold with either a 12mm or 27mm eyepiece attached to the black box that contains the webs and web holding mechanism. The silver handle to right is the micrometer thimble and spindle to adjust the movable web. A protractor shown is shown behind the black box and is free to rotate 360 degrees to measure the position angle of the double stars. BOTTOM: Darbinian micrometer thimble and spindle for reading separation in millimeters.
In our first example, Mars is observed January 27, 2010 in
perfect seeing using a 16-inch (406.4mm) f/6.9 telescope with an
effective focal length of 8,532 millimeters (3.04x Barlow used).
We find the screw constant or image scale then becomes; 206,265 /
8,532 mm = 24.18 arcsec/mm. We might have measured the north
polar cap when the planet was 12.3 seconds of arc in apparent
diameter and a Sub-Earth Point or Declination of the Earth
(De) of 14.9°.
The reason for the measurements is to determine the apparent latitude (L) of the east-west edges of the polar cap using a standard spherical geometric equation:
( 1 ) L = cos-1 (C/D),
Where C is the measured
width of the polar cap measured and D is the
measured diameter of the disk of Mars.
USING DIRECT-INDIRECT METHOD
The method used in this article for measuring the polar caps with a bi-filar micrometer is the Direct-Indirect Method [Peek, 1981]. This method is desirable because it reduces possible mechanical errors in the micrometer and eliminates the need to compute the micrometer zero. In this method, half of the measurements are made on one side of the fixed web and half on the other side.
To measure the disk of Mars with Direct-Indirect method: the disk is measured directly (Di) between the fixed (F) and movable (M) webs, then Mars is positioned across the fixed web to the other side (See Figure M3-3 ). The movable web is adjusted across the fixed web and the disk is then measured indirectly (In) with the opposite screw adjustments. Finally, the thickness of the webs (Wt) is subtracted. The results are averaged and the separation of the webs is determined by: separation = (Di - In) / 2 – web thickness [Beish et al, 1986].
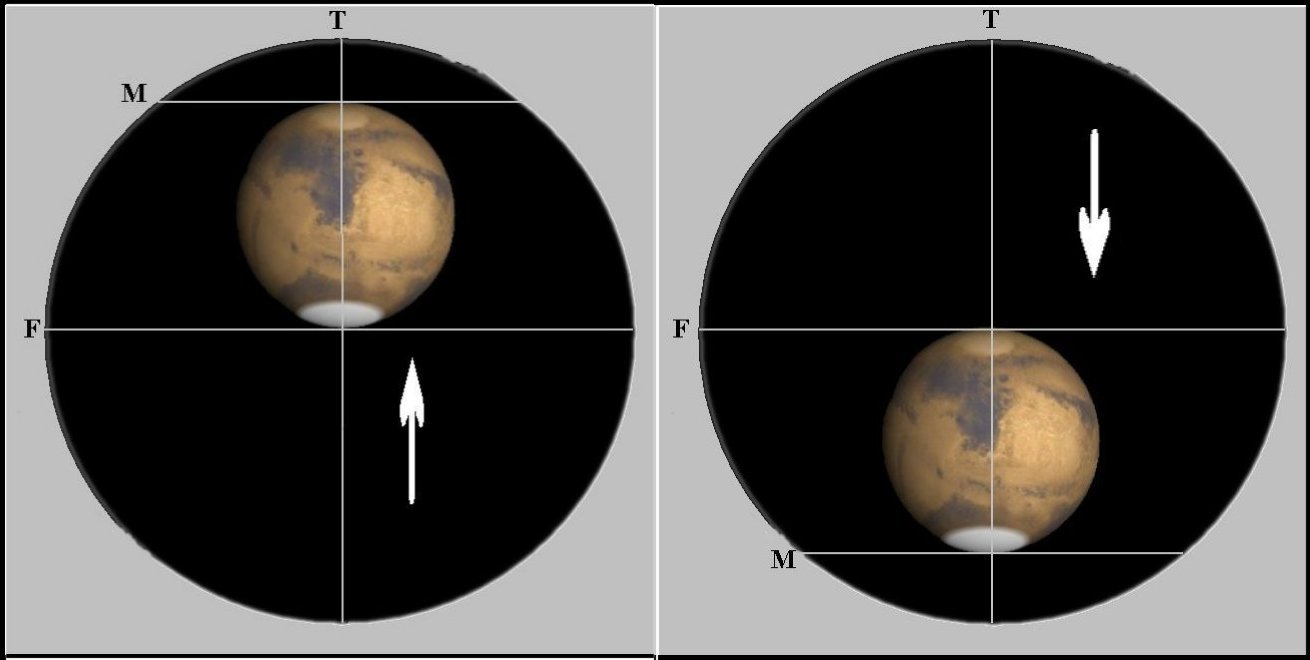
Figure M3-2. Appearance of Mars in micrometer eyepiece using ALPO method. For measuring the disk of Mars on the DIRECT side, as shown in the left image, using the telescope drive slow motion controls Mars is situated between the movable web (M) and the fixed web (F) and the micrometer separation is recorded. In the right image Mars is driven down and the movable web (M) is adjusted up and across the fixed web (F) in the INDIRECT side and the micrometer separation is recorded. The web (T) is used for centering. Measuring the apparent disk (D) of Mars will be used in both methods described below.
Measuring the apparent disk diameter
(D) we find Direct (Di) =
11.1980 mm and Indirect (In) = 10.1564 mm, and
web thickness of 0.012 mm, therefore the separation of the webs
is determined by:
D = (Di - In) / 2 - Wt = (11.1980 – 10.1564) / 2 - 0.012 = 0.5088 mm
Second, the micrometer is rotated 90 degrees to the right, as the arrow indicates in Figure M3-3 , and the webs are then returned to their initial positions -- that is with web (M) back across web (F). The polar cap breadth or East to West span across the sphere of the planet is measured directly and indirectly.
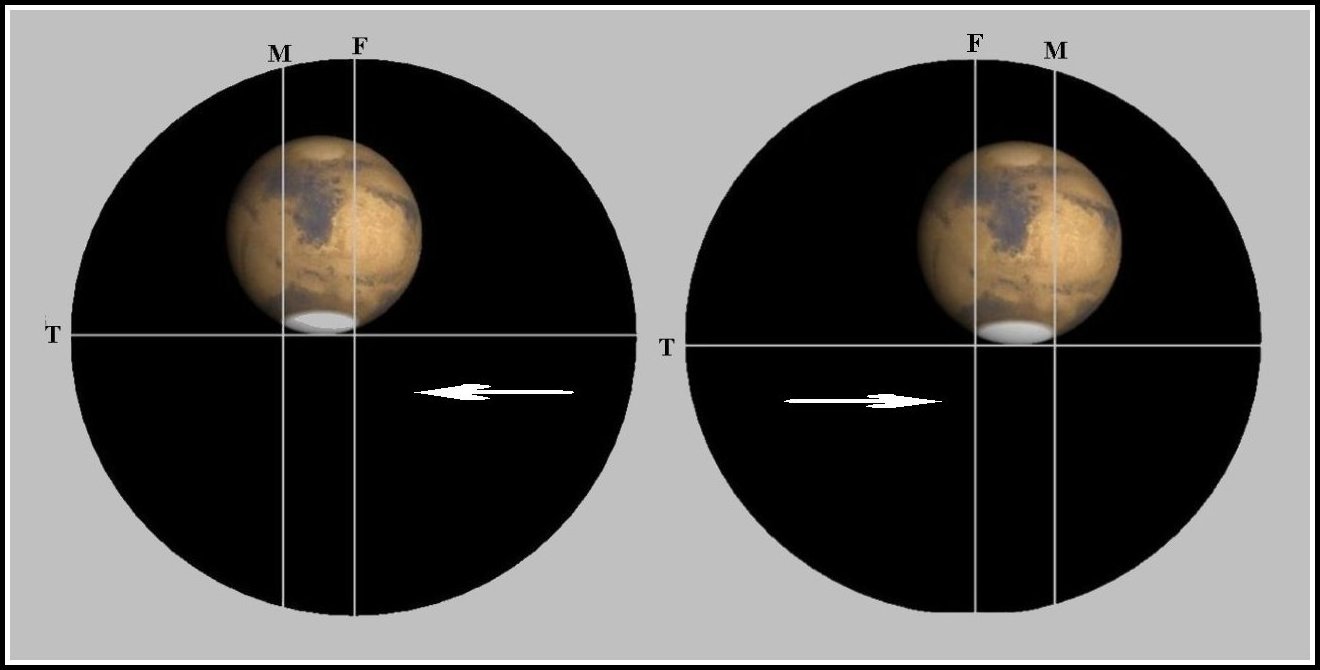
We find the polar cap width (C) is 0.153 mm from the Direct (Di) = 10.8422 mm and Indirect (In) = 10.5122, therefore:Figure M3-3. Appearance of Mars in micrometer eyepiece using ALPO method. In the left image, the apparent polar cap (C) is situated between the movable web (M) and the fixed web (F) in DIRECT side. Right image Mars is moved right by the telescope drive and the apparent polar cap (C) is situated between the fixed web (F) and the movable web (M) in the INDIRECT side. The movable web (M) is adjusted right and across the fixed web (F). The web (T) is used for centering.
C = (Di - In) / 2 - Wt = (10.8422 - 10.5122) / 2 - 0.012 = 0.33 / 2 - 0.012 = 0.153 mm
Next, usung equation (1) the apparent latitude (L) is: L = cos-1 (0.153 / 0.5088) = 72.5°
To compute width
(W) of the polar cap this equation is
used: W = 2 sin-1 (C/D)
, where C = 0.153 mm and D = 0.5088 mm from
above:
( 1a
)
W = 2 sin-1 0.153 / 0.5088 = 2
* sin-1 (0.3007) =
35.0°
Systematic error due to “astronomical seeing”: If the image of Mars would expand (blur) by one-micrometer web, or 0.012 mm, we would find the cap width and disk diameter vary from 0.153 mm to 0.165 mm and the disk from 0.5088 mm to 0.5208 mm respectively, then: L = cos-1 (0.165 / 0.5208) = 71.5°, with an error of -1°.
ALTERNATE METHOD TO MEASURE POLAR CAP
The alternate method often uses drawings to determine the polar cap latitudes of Mars [Dollfus, 1973] and may be subject to additional systematic errors due to personal errors or hand-eye coordination problems.
Using the Micrometer "Zero" Method: First, we must find the micrometer "zero" and this is accomplished by positioning the movable (M) web exactly over the fixed (F) web, then writing down the micrometer thimble and spindle readings. In the case of the author's micrometer the "zero" is 10.6772 mm. The manufacture of this micrometer used a Black Widow spider web and determined it to be 0.012 mm (Wt) in thickness.
First, we measure the apparent disk diameter (Dd) as we found by measuring the north to south thickness (D) of the visual image of Mars in the micrometer eyepiece, as indicated in left side of Figure M3-4 we find:
Dd = (D - Zero) - Wt = (11.1980 - 10.6772) - 0.012 = 0. 5088 mm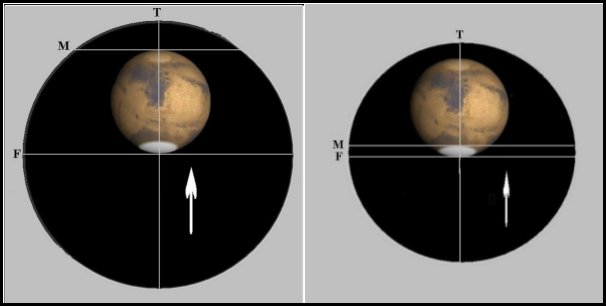
Figure M3-4. Appearance of Mars in micrometer eyepiece using ALTERNATE method. In the left image, the apparent disk (D) is situated between web (M) and web (F) in Direct side. Right image Mars is moved down by the telescope drive and the apparent polar cap (C) is situated between web (F) and web (M) in the Direct side. The movable web (M) is adjusted down and across the fixed web (F). The web (T) is used for centering.
Next, find the planetocentric angle (β) of the polar cap by measuring the north-south thickness of the polar cap as shown in figure M3-4. The apparent disk (0.5088 mm) is measured as in figure M3-2 and the radius is determined by dividing this diameter by 2. Then take the absolute value the Declination of Earth (De) to find the planetocentric latitude of the Earth (|∅|) and apply these to the following geometric equation:
where β is the planetocentric angle of the polar cap, De is the Declination of Earth, d is the thickness of the cap, and r is the radius of the apparent disk.
The north-south width of the polar cap was found by:
Cd = (C - Zero) - Wt = (11.1980 - 11.1465) - 0.012 = 0.0395 mm
With a De of 14.9° and the cap thickness (d) = 0.0395 mm and the radius (r) of Mars’ disk (0.5088 / 2) = 0.2544 mm:
β = cos-1 (1 – d / r) - |16.6°| = cos-1 [1 – (0.04374 / 0.2544)] - 14.9° = cos-1 (0.844733) = 32.4° - 14.9° = 17.5°
Note: The latitude of the polar cap at the central meridian = 90 - β, or 90° - 17.5° = 72.5°
Systematic error due to
“astronomical seeing”: If the image of Mars would expand
(blur) by one-micrometer web, or 0.012 mm, we would find the cap
width and disk diameter vary from 0.0395 mm to 0.0515 mm and the
disk radius from 0.5088 /2 mm to 0.5208 / 2 = 0.2604 mm,
respectively, then:
β = cos-1 (1 - (0.0515 / 0.2604)) - |14.9°| = 38.2° - 14.9° = 21.8°,
then the latitude would be: 90° - 21.8° = 68.2°. The result is an error of 4.3° (72.5° - 68.2°).
EFFECT OF PHASE DEFECT ON POLAR CAP MEASUREMEMNTS
There is one other problem -- the Martian phase. The Red Planet can have a significant phase defect, or terminator, near quadrature when Earth-based observers will see less than a fully illuminated disk. However, if the angle of the phase defect (terminator) is in the opposite hemisphere from the De, i.e., the De is positive and the PA of Defect is negative, then the terminator cusp will be clear of the edge of the polar cap. In this case there will be no problems with our calculations. Note: Shortly before or after opposition, the phase becomes undetectable as it approaches 99%. Phase corrections for polar cap measurements are unnecessary for phases of 99% or more.
Now for a practical example we find the Red Planet near quadrature and usually a phase terminator will be present. For example, on November 01, 2009 there will be a 39.4° phase angle (i) present, so Earth-based observers will only 88.7% of the illuminated disk of Mars.
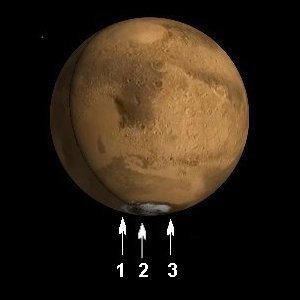
From the example in the above Figures M3-2 and M3-3 we measure the north cap C = 0.153 mm and disk D = 0.5088 mm and determined that the latitude would be 72.5°. However, during those times when the polar cap is partially covered by the terminator, as illustrated in Figure M3-5 , the latitude must be corrected by dividing the measured cap by the phase defect (k):Figure M3-5. Simulated view of Mars on 11-01-2009 with a phase angle (i) at 39.4°, Positional Angle of Axis (P) = 355.1° and the Positional Angle of the defect (Q) = 284.8°. Figure M3-6. Illustrates the incidence angle of the Sun, ("Is"). Maximum Phase (Qm) = 289.3°. The evening edge (arrow-1) of the cap is hidden by phase defect, the apparent evening edge (arrow-2) and the morning edge (arrow-3) of the cap.
( 3 )
Correction for the north polar cap: AC = C / k = 0.153 /
0.887 = 0.1725
( 4
) Corrected
latitude B = cos -1 (AC
/ D) = cos-1 (0.1725 /
0.5088) = 70.2° N
Where k = 0.5 (1+cos i) and "i" is the angle of defect, or, "phase angle."
Another problem leading to systematic errors in polar cap measurement is the fact that the cap may be clear of the phase altogether. Or it may be tilted sufficiently towards the earth so the cap is less embedded in the shadow, again making equation (3) less accurate. The phase defect or "terminator" can cover some or all of the polar cap at times; Figure M3-6 illustrates the effects of a positive or negative effect of the Martian axis position angle and the position angle of the defect. Formula (4) applies only when the incidence angle of the Sun, ("Is") is 0°. This angle is derived as follows:
where "Q" is the Position Angle of the Defect, "P" is the Position Angle of the Axis, and remembering to normalize the results to under 360°.
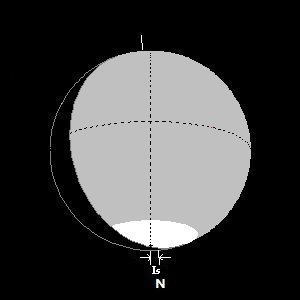
Figure M3-6. Illustrates the incidence angle of the Sun, ("Is").
PHASE ANGLE EQUATIONS : Phase (k’) is the ratio of the polar diameter to the illuminated portion of the equatorial diameter. The equation for phase is:
[5a] North Polar Cap: Before Opposition and if Is >0° then k’ = (1 + cos i) / (1 + cos Is)Note: Shortly before or after opposition, the phase becomes undetectable as it approaches 99%. Phase corrections for polar cap measurements are unnecessary for phases of 99% or more.
In Figure M3-5 (11-01-2009) the phase
(i) = 39.4°, Q = 284.8° and P = 355.1°, so we
calculate: Is = 270° - (284.8° – 355.1°) =
340.3°. In the example we find that Mars has not reached
opposition and it has a phase that is tilted with an angle Is =
340.3°, so we will use formula [ 5b ] that results
with:
k’ = (1 + cos 39.4°) / (1 + cos 340.3°) = 1.7727336 / 1.94147 = 0.913
Now that the part of the phase defect which affects the cap has been corrected (k’), we can rewrite equation (4) above to yield the correct cap width:
[ 6 ] AC = C/k’
and, finally, use equation (3) to yield the latitude (B) of the edge of the Polar Cap:
B = cos-1 (AC / D), where AC = 0.153 / 0.913 = 0.1676
The Areocentric corrected latitude is; B = cos-1 (0. 1676/ 0.5088) = 70.8°.
The difference between the corrected latitude using only the phase and when considering all the angles is 72.5° - 70.8° or 1.7°. These differences may be considered as large systematic errors.
POLAR CAP MEASUREMENTS WITH CCD CAMERA
While we found a less than two degree (1.7°) systematic error in latitude using photographs to measure the polar caps of Mars these systematic errors are reduced significantly when using CCD images. A typical set of CCD images of Mars taken in fair to good seeing conditions easily replaces the time and effort used at the telescope using a micrometer. Also, the reduction of the images can be done in the comfort of your home instead of peering at Mars at the micrometer eyepiece.
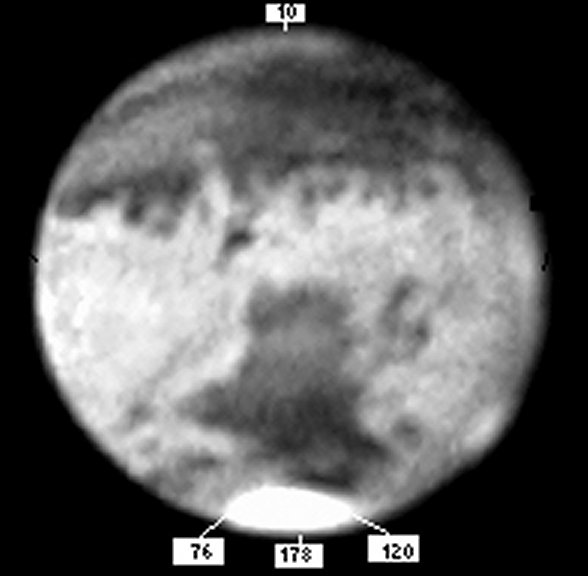
Figure M3-8. Typical Don Parker CCD image of Mars as shown on PC screen using image processing program (south at top). Cursor placed at extremes of north - south and east - west of image. Resulting pixel locations are 10 to 178, and 76 to 120. Differences or distances are: 178 - 10 = 168 and 120 - 76 = 44.
In Figure M3-7 the CCD image of Mars was taken with a deep red filter to cut through the atmospheres of both Earth and Mars. Using a typical image-processing program the image is rotated on the screen so the disk is seen pole to pole relative to the image frame. The cursor is placed at the north and south edge, or limb, of the image and the pixel positions of each are recorded. Next, read the cursor/pixel position of the east and west edges of the polar cap. Using the pixel positions of the image on the PC screen is the same as using the fixed and movable webs of the micrometer, as all we need for the calculations is simple ratio.
The apparent disk of Mars (26.1-arcsec) is measured from north (pixel-178) to south (pixel-10) that yields a difference of 178 – 10 = 168 pixels. The extent of the east (pixel-76) to west (pixel-120) edge of the polar cap yields a difference of 120 - 76 = 44 pixels. So, one has only to record the two pixel locations to determine the distance between the features on Mars. Taking the difference of the positions, apply these values to the proper conversion equations to determine the latitude. Applying the differences or distances between extents using the equation above, we find:
L = cos-1 (44/ 168) = cos-1 (0.2619048) = 74.8°
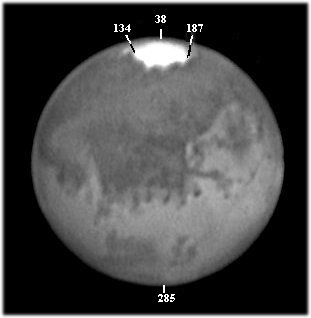
Figure M3-9. Another Don Parker CCD image of the 26.1-arcsec planet Mars taken at closest approach on 27 August 2003 as shown on PC screen using image processing program. Cursor placed at extremes of north - south and east - west of image.
In figure M3-8 the apparent disk of Mars is measured from north (pixel-285) to south (pixel-38) that yields a difference of 285 - 38 = 247 pixels. The east (pixel-134) to west (pixel-187) extents of the edge of the polar cap that yields a difference of 187 - 134 = 53 pixels:
Latitude = cos-1 (53/ 247) = cos-1 (0.2145745) = 77.6°
Since the south polar cap is offset from the pole by approximately 7° in the general direction of 30° - 60° Areographic longitude we usually use the width (W) of the cap to study this region and can be found using the equation:
W = 2 * sin-1 (53 / 247) = 2 * 12.39 = 24.8°
One can re-calculate this by converting the pixels to seconds of arc with the understanding that Mars was 25.1-arcsec in apparent diameter and that represents 247 pixels in the image or 247-pixels / 25.1-arcsec = 9.84 arcsec/pixel. The width of the polar cap is 53 pixels, so converting that to seconds of arc is: 53 / 9.84 or 5.386 arcsec. Using the equation above:
Latitude = cos-1 (5.386/ 25.1) = cos-1 (0.2145745) = 77.6°
And then width: W = 2 * sin-1 (5.386/ 25.1) = 2 * 12.39 = 24.8°
TECHNIQUE
Using a typical image processing programs an image is opened to the screen and usually the image gamma and/or brightness and contrast, and image scale is increased 2x to 3x to show the pixel patterns at the edges of Mars’ limbs and polar cap. If the image is not sharp then some image sharpening may be necessary until the pixels can be distinguished (see Figure M3-9).
To find the very edge of the feature, especially in a fuzzy image, one clicks the proper icon to read the “Red, Green, Blue” density levels of the dark background and then drag it onto the image at a point where the levels appear to indicate an exposed pixel. The real edge can be assumed to be somewhere between the background and the apparent exposed pixels. (Note: pixel X-Y is displayed in bottom toolbar in Paint Shop and “dropper” icon is equivalent to Adobe Photoshop “Info palette window” using the “eyedropper tool”).
In this example the cursor ‘X-Y’ pixel is set near edge in background to (74, 80) and the RGB levels may read ’43.” Moving the cursor right into the brighter edge, the RGB levels begin to increase to read ‘63” at ‘X-Y’ pixel (80, 80). Then, move the cursor further right until the RGB levels become stead at ‘83’. Move back until it begins to decrease and record RGB levels ‘63” at ‘X-Y’ pixel (86, 80). For a movement of +/- 6 pixels we find the RGB levels average: (83 + 43) /2 or 63. That is the assumed real edge of the feature. In Figure M3-9, the image us of a magnified section of the evening side of the north polar cap.
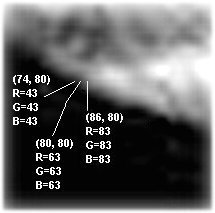
Figure M3-10. A 3X magnified section of the evening side of the north polar cap of Mars as shown on PC screen using image processing program. Cursor move and at least tree X-Y positions and RGB levels recorded.
Reference
Dollfus, Audouin, (1973), "New optical measurements of planetary diameters IV. Size of the north polar cap of Mars," Icarus 18, 142.
Return to Polar
Caps