April 25, 2019
Viewing the eta Aquariids in 2019
The eta Aquariids (ETA) are active between April 17 and May 24. The strongest activity is usually seen near May 7, when rates can reach 25-30 meteors per hour as seen from the tropical areas of the Earth. Unlike most major annual meteor showers, there is no sharp peak for this shower, but rather a plateau of good rates that last approximately one week centered on May 7. The eta Aquariids are particles from Halley’s Comet, which last passed through the inner solar system in 1986. The meteors we currently see as members of the eta Aquariid shower separated from Halley’s Comet hundreds of years ago. The current orbit of Halley’s Comet does not pass close enough to the Earth to be a source of meteoric activity.
The eta Aquariids are only visible during the last couple of hours before the start of morning twilight. The reason for this is that the radiant (the area of the sky where these meteors appear to shoot from) is situated approximately 60 degrees west of the sun. Therefore it rises before the sun in the morning hours. The time of radiant rise is between 2:00 and 3:00 local daylight saving time (DST), depending on your longitude. The real key is the latitude. There is an observing window for this shower between the time the radiant rises and the beginning of morning nautical twilight. This window ranges from zero at 60 degrees north latitude to all night in Antarctica. Unfortunately in Antarctica, the radiant never rises very high in the sky and most of the activity is not visible from there. The best combination of a large observing window and a decent radiant altitude occurs between the equator and 30 degrees south latitude. From this area the radiant reaches a maximum altitude of 50 degrees at nautical twilight. The observing window ranges from 3.5 hours at the equator to slightly over 4.0 hours at 30 degrees south latitude. Going further south will increase your observing window but the maximum altitude will begin to fall closer to the horizon.
Since most meteor observers live in the northern hemisphere, here are the conditions at several different latitudes: the observing window for 50N is 1.5 hours with a radiant altitude of 15 degrees. The observing window for 40N is 2.25 hours with a radiant altitude of 25 degrees. The observing window for 30N is 2.75 hours with a radiant altitude of 35 degrees.
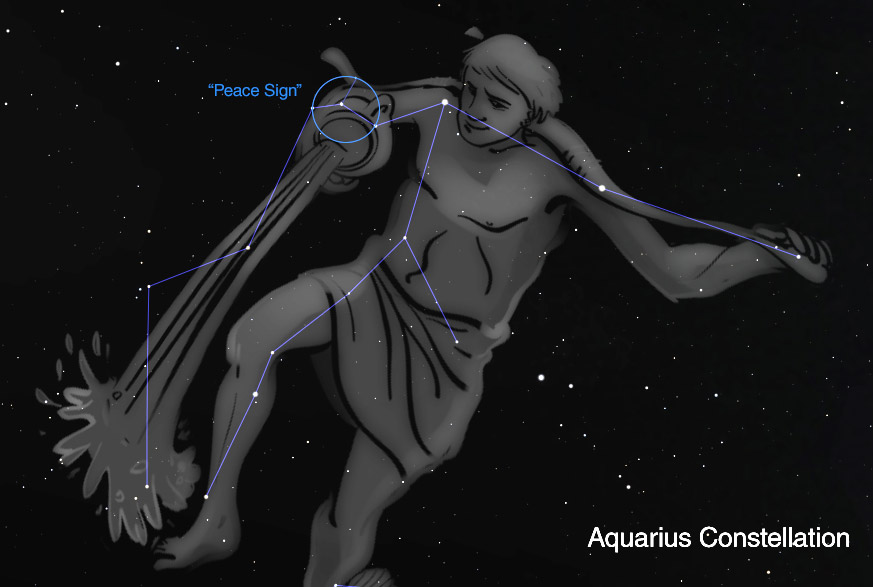
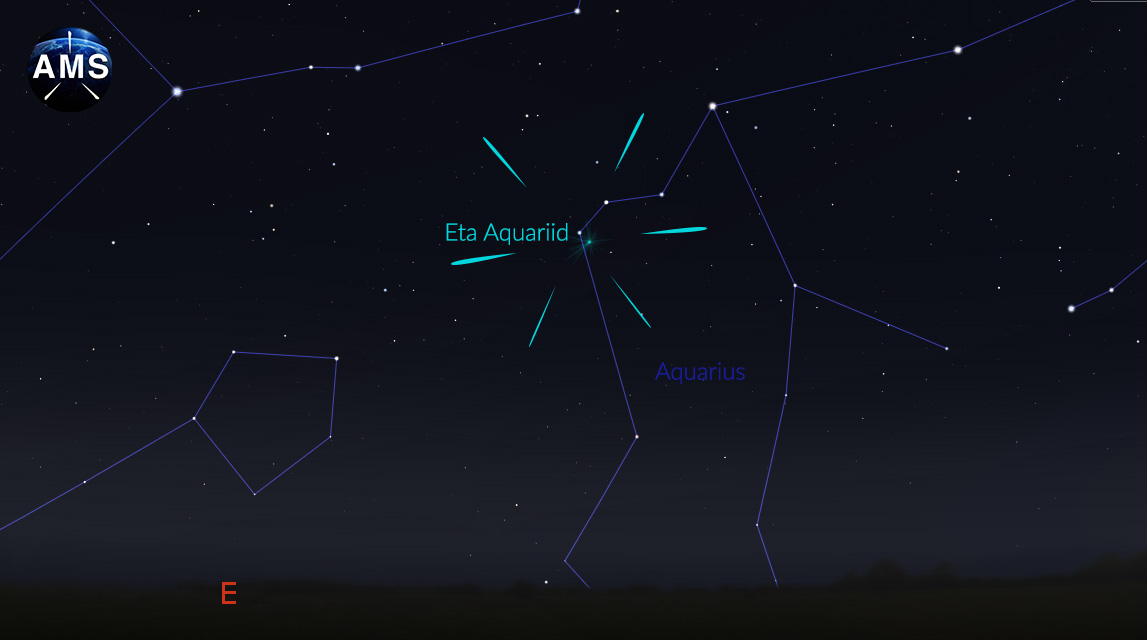
Near maximum, the radiant may be easily spotted as it lies near the “water jar” in Aquarius. This “Y” shaped pattern of stars is also known as the “peace sign” to some observers. It should be noted that very few meteors are actually seen at the radiant. This position just happens to be the apparent source of the activity. More activity is seen further up in the sky where longer shower members can be seen. That is why it is advised to look half-way up in the sky. Do not look straight up as this is the direction of least meteoric activity. By looking at the zenith you are looking though the thinnest slice of atmosphere possible. This is great for lunar and planetary viewing but not for meteor observing. Have the horizon be at the bottom of your field of view and your center will lie near the optimal forty-five degree altitude zone.
The conditions for viewing the eta Aquariids in 2019 are close to perfect. A new moon will occur on May 4, only a few days before maximum activity. The moon will not start to interfere with viewing these meteors until May 13, when it sets shortly after the radiant rises in the opposite side of the sky.
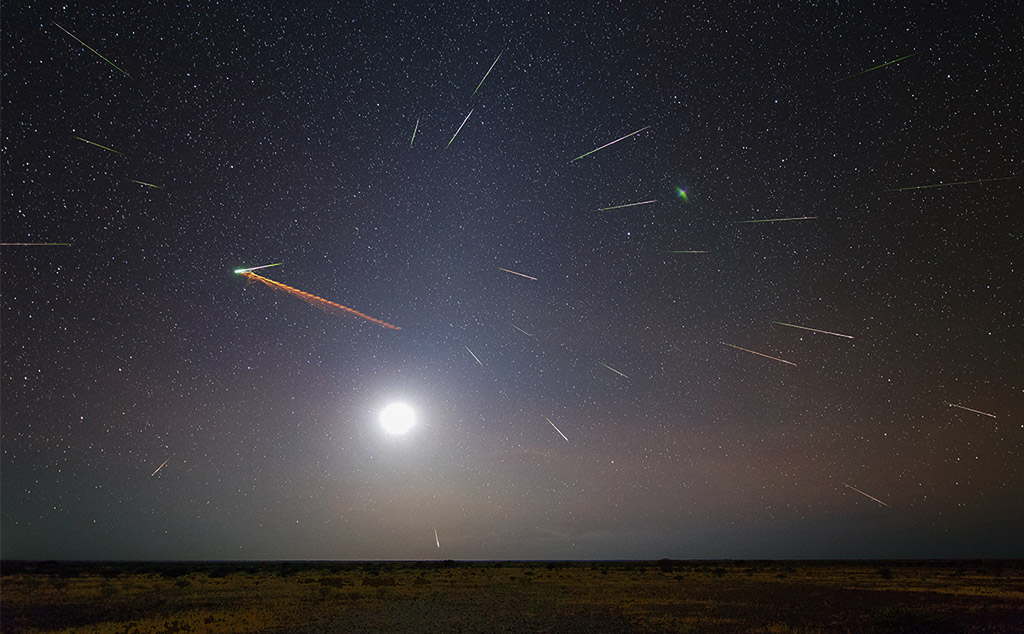
To best see these meteors you should start viewing near the time the radiant rises. This is between 2:00 and 3:00am for most observers situated at mid-northern latitudes. It would be best to view toward the eastern half of the sky with the radiant in the lower portion of your field of view. This way you can see these meteors shooting in all directions out of the radiant, even downwards. This suggestion is good for all observers no matter your location. These meteors will shoot in all directions, especially low in the northeast and southeastern sky. The best ones will shoot straight upwards through the center of your field of view. The eta Aquariids are swift meteors leaving a high percentage of persistent trains. Unlike the Geminids and Perseids, fireballs from this source are rare.
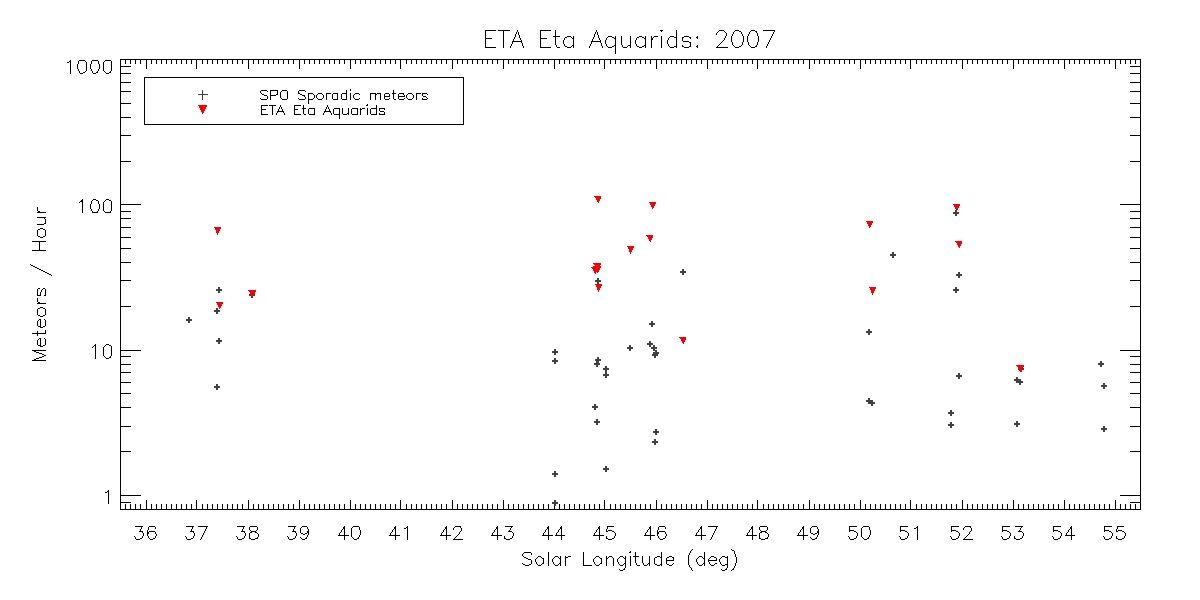
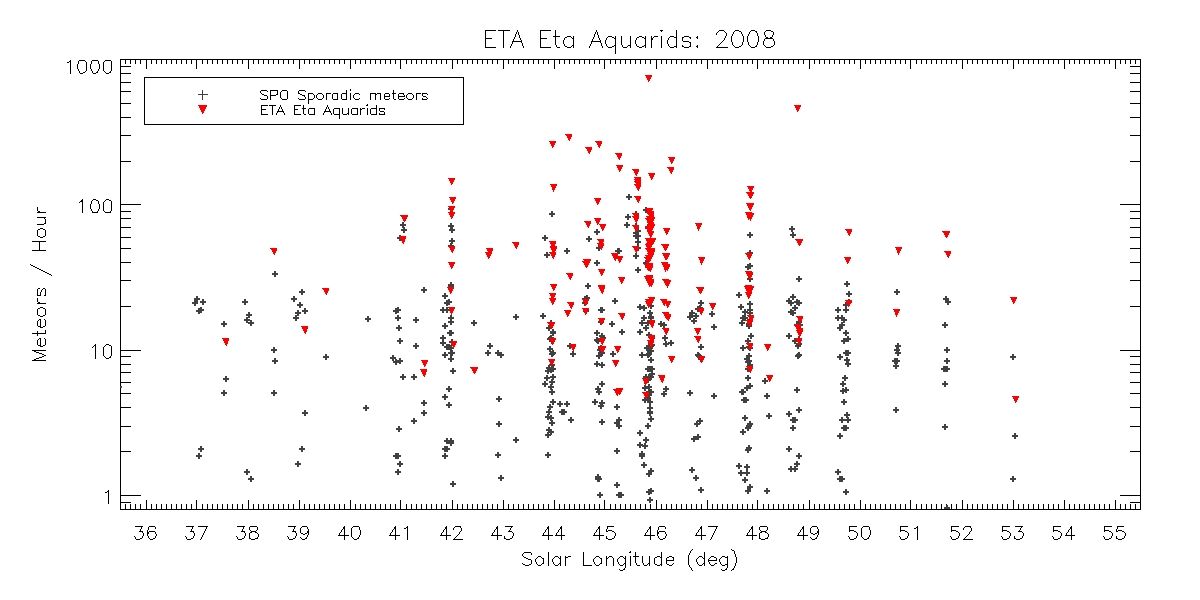
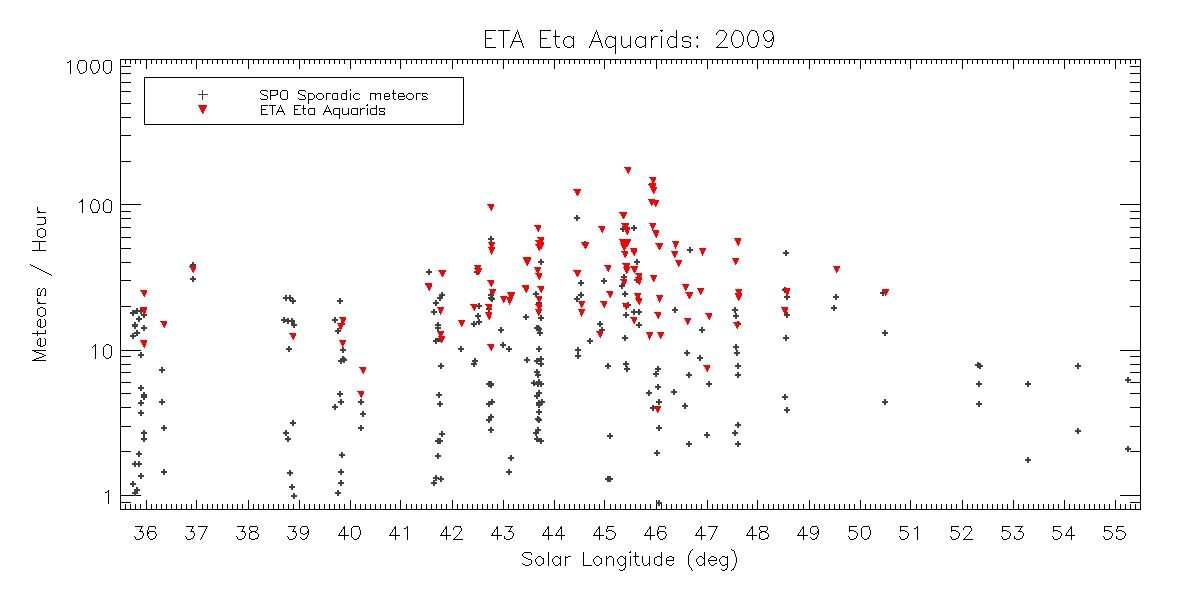
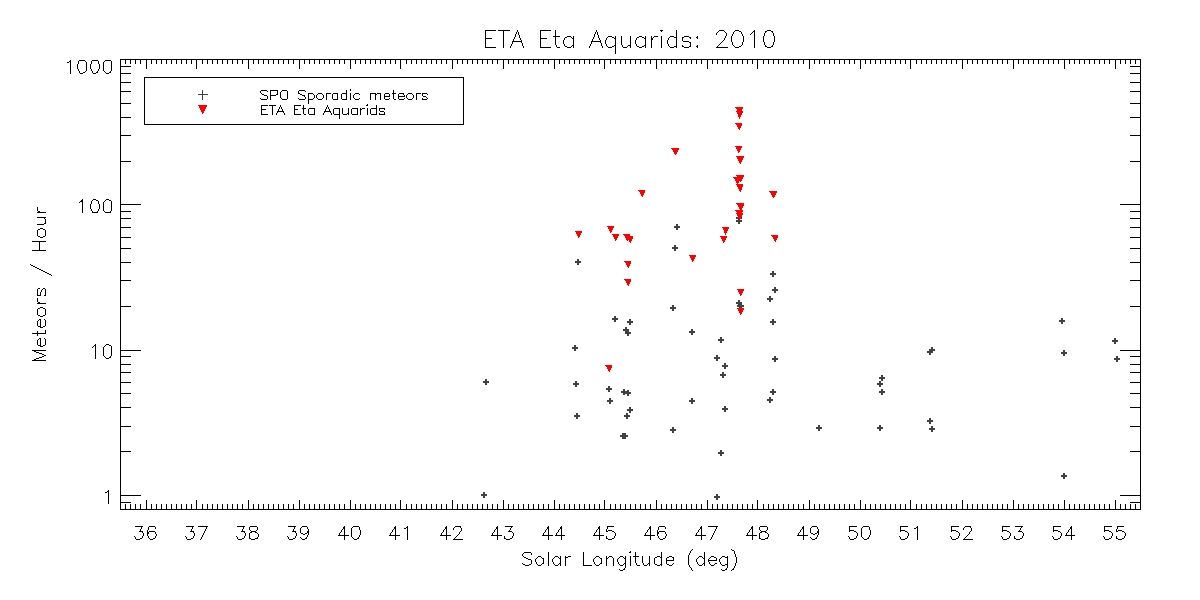
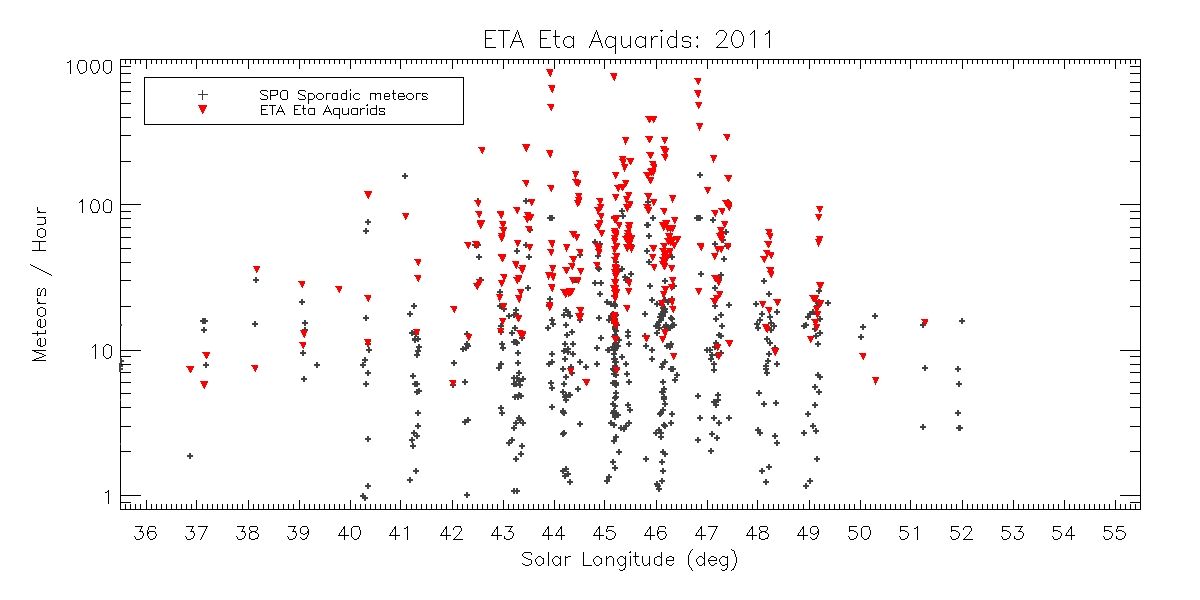
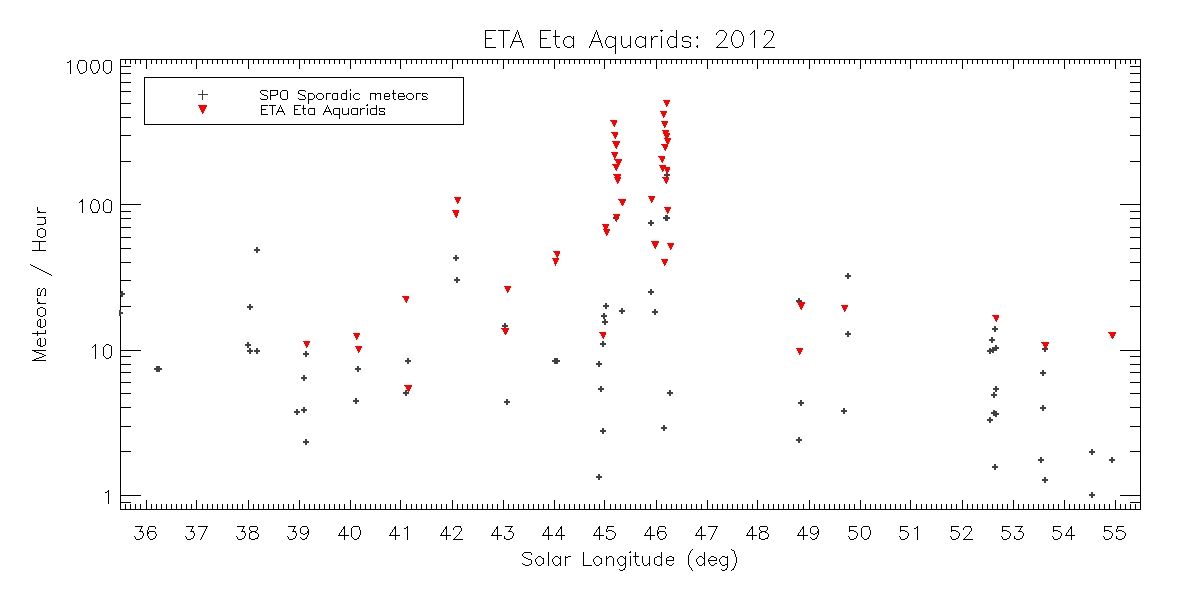
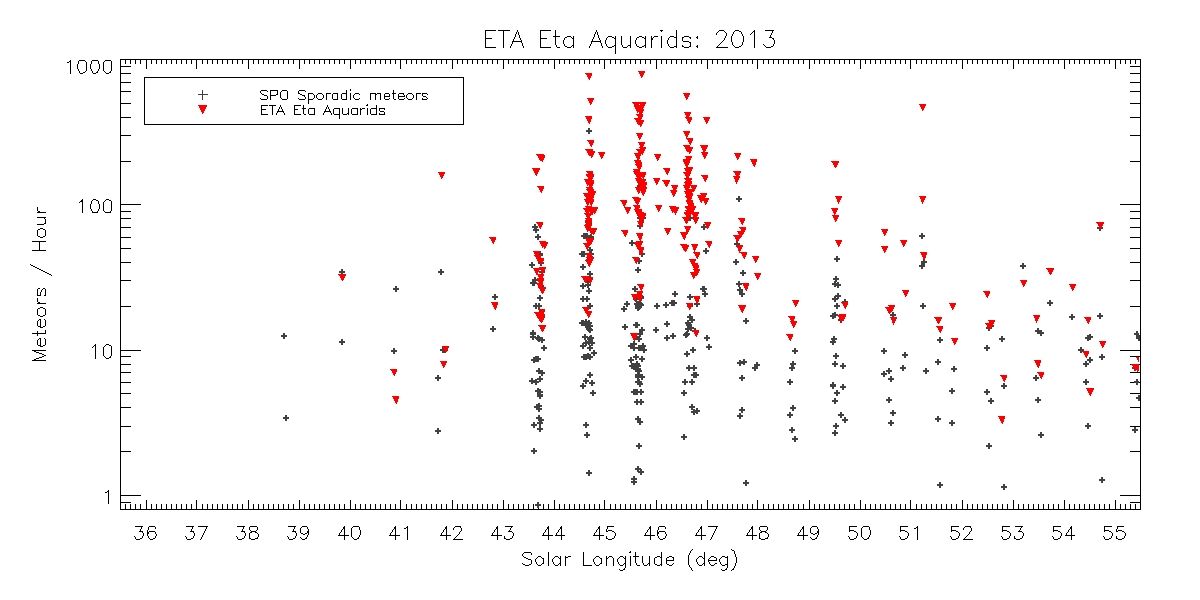
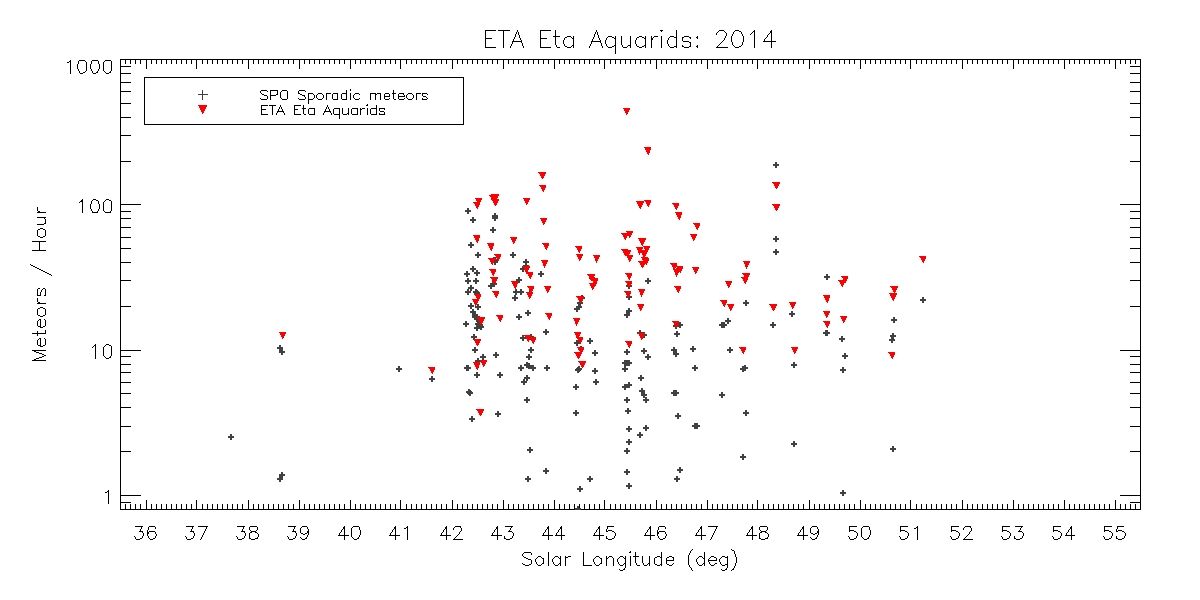
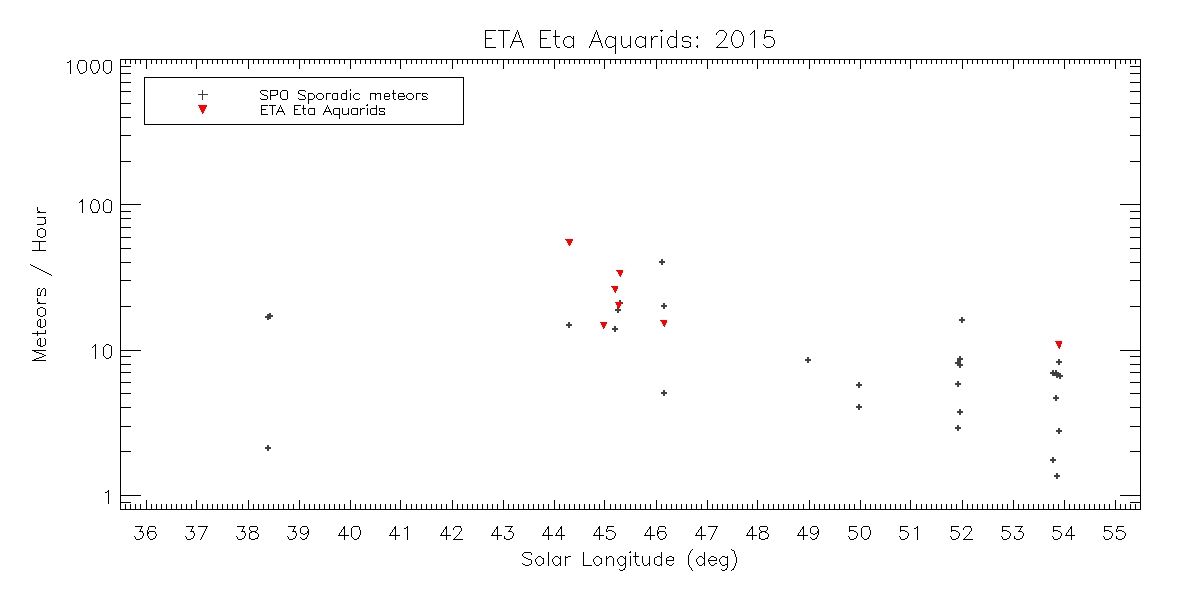
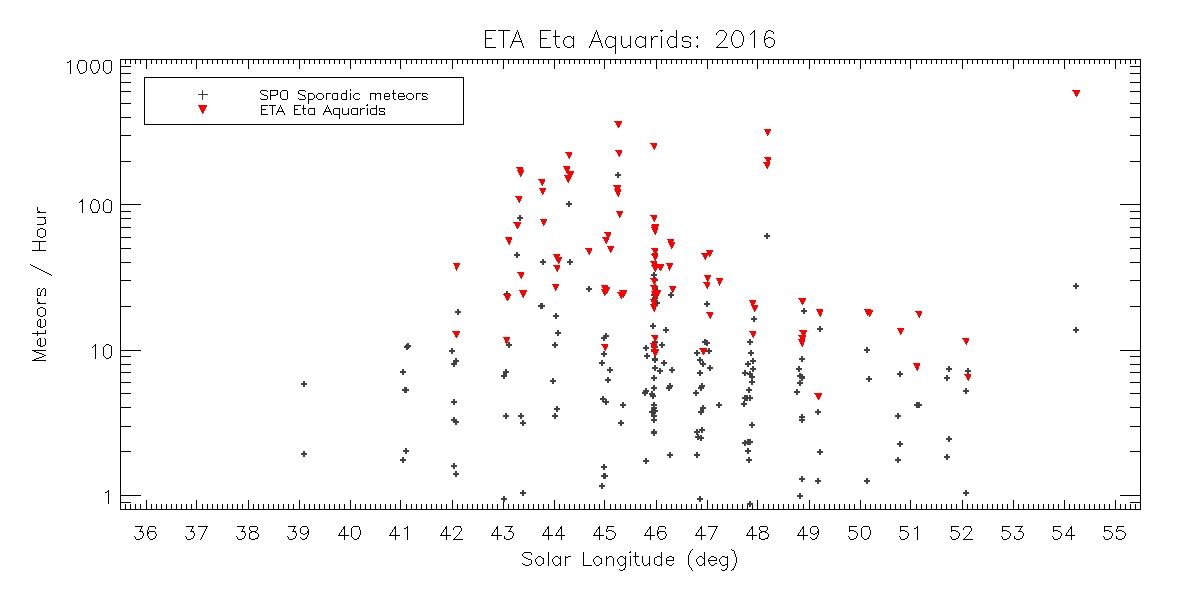
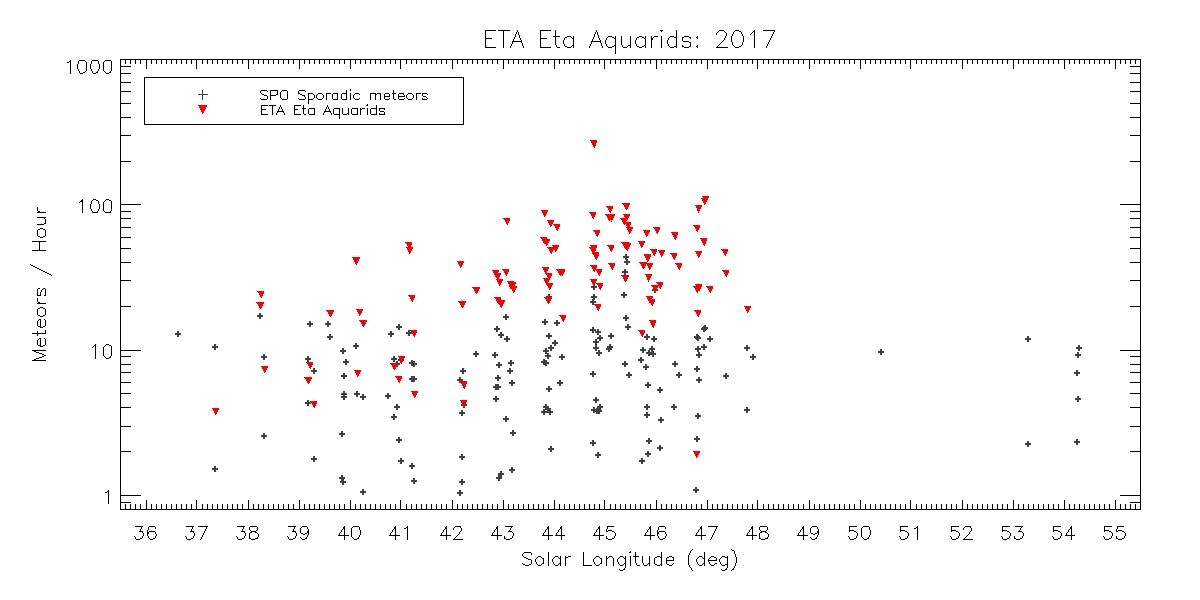
The graphs below show eta Aquariid and sporadic activity from 2007-2017. Each dot represents a single hourly rate reported by a single observer, corrected for effective time, obstructions, sky conditions, and zenith angle. Reported sporadic rates are also plotted for reference (also corrected for effective time, obstructions, and sky conditions). Each plot is in terms of Solar Longitude, not date, allowing direct comparison between years. The expected maximum for the eta Aquariids each year lies at solar longitude 46.2 Due to the usually low zenith angle of this shower, there is a large amount of data scatter and a broad, ill-defined peak even in a good year without lunar interference.
The graphs are courtesy of James Richardson using data from the International Meteor Organization (IMO). It should be noted that the corrected rate values do not represent rates that anyone will actually see, but are simply a way of combining raw meteor hourly rates from multiple observers in various locations and observing under disparate conditions. The corrected raw data does a good job of showing the ramp up and ramp down of each shower as they occur/occurred, where the actual ZHR will be roughly in the *middle* of the plotted numbers (that is, don’t follow the top of the plot, watch the middle of the plot). Also note that the vertical scale is logarithmic, such that a typical shower will generally ramp up and down in ‘saw tooth’ fashion, forming a triangular peak (sometimes with asymmetrical sides).
Meteor shower rates, as seen by an individual observer, are quite random (following a Poisson distribution), more random than most people intuitively expect, such that wide variations from one hour to the next can occur, or wide variations between two observers at two different locations in the same hour. The plots also point to the importance of observer accuracy in reporting their observations: times, counts, limiting magnitude, sky obscuration, shower member identification. I think it is elucidating for observers to see their raw and minimally corrected (normalized) rates directly, rather than as a averaged, single value with error bars.