Solar Section        


March 4, 2017

The 2017 Solar Eclipse – Part 1

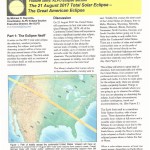
In preparation for the Great American Solar Eclipse on August 21 2017, the ALPO Solar Section will publish a number of articles which were originally written by Dr. M. D. Reynolds for ALPO’s Journal, “the Strolling Astronomer”. The first article was published about a year ago in the Winter 2016 issue. To get up to date for this exciting event, follow the articles as they are published here. Click the following link, or right click the link to download the first pdf for off line reading .
The 21 August 2017 Total Solar Eclipse – Part 1


July 18, 2016

Scanning Recommendation for Solar Drawings

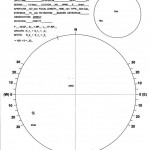
Recent questions about what format drawings should be in when submitted to the Solar Archive, prompt us to write this post. Despite that many say that they want the highest quality and thus scans should be submitted in the highest possible resolution, this does not make a lot of sense. Drawings are made typically by pencil or a marker. In addition, the drawing should as accurately reflect what someone saw and document this accordingly. Think of it as this way: If you scan at 200 dpi (dots per inch) this means that the scanner will create a dot if it finds a line that is 1/200 of an inch or 1/8 of 1mm. So the question becomes can you draw features on a Solar disc and accurately position it to that scale? Without any further aid probably not. In addition, images are mostly available in the jpg format. This standard format allows a compression grade of 1 to 12 for the file data in the image, so the file becomes smaller in size. A full 8 1/2 by 11 sheet could take up 7 MB or larger when uncompressed, but compressed it might be only 250 – 300 kB. This is a huge difference if images need to be downloaded or processed.

So let’s take a look at how a PC does display images and data. A typical PC monitor is approx. 1250 pixels wide. Some are wider and others have less pixels available. So if you were to display the width of an 8 ½ x 11” paper across the width of the screen you would have 1250 pixels available and the screen is probably 13 to 15 inch wide. This would mean that if the page was displayed across the width of the entire screen, it displays at approx. 1 ½ times the size of the real sheet of paper and it would be displayed at a resolution of 1250/8 ½ or approx. 150 pixels per inch. This would be the optimum resolution for that screen to display that page. Images captured with the current technology also have a similar resolution of 1200 -1800 pixels wide. So increasing the resolution only makes the image bigger resulting in only a portion of that image being displayed on the screen and does not necessarily increase the clearness of what you did draw.

We have taken a good look at what the best format for our purpose is, and we have concluded the following: A scan with 150 to 200 dpi produces sufficient data to properly represent what’s on the paper you scanned for analysis, as well as reproduction in printed form. In addition, when the image is saved in the form of a jpg, a compression grade of 5 to 6 for the data compression, retains more than sufficient data to properly reconstruct what was scanned. This compression grade number is displayed in many programs when the file is saved as a jpg file, including Photoshop CS or PS Elements. So to summarize, for images to be submitted in our archive we prefer if you can scan drawings as follows:

Scan with 150 to 200 dpi.
Use jpg compression grade at 5 to 6 when saving the file.

This should produce files of reasonable size for on-line access. Remember, there are still many individuals who like to see your images, but they also have to deal with slow internet, or even dial up speeds.
Thanks for your consideration, and if you have any further questions or suggestions, please do not hesitate to send your question/suggestion to solarimages@alpo-astronomy.org .
Clear Skies,
The Solar Team.


June 17, 2016

ALPOSS – A report on CR2169 thru CR2173


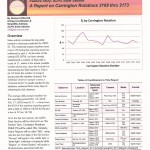
ALPOSS’ Acting Coordinator and Scientific Advisor Richard Hill continues his detailed reports of the Carrington Rotations. This time he covers 5 Carrington Rotations: CR2169 thru CR2173. The reports are based on over 500 submissions of numerous contributors to the Solar Observations Archive. The report was published in the 2016 Summer issue of the JAPLO and can now also be accessed as a stand alone document on ALPOSS’ Solar Observations & Reports page, or downloading by “right”clicking on the picture below.


June 7, 2016

A short Summary of Carrington Rotation 2177


Carrington Rotation 2177 covered the time period from 2016-05-10 – 0053 UT until 2016-06-06 – 0557 UT
Submitted observations can be viewed in ALPO’s Solar Archive for CR2177:
http://www.alpo-astronomy.org/gallery/main.php?g2_itemId=82541
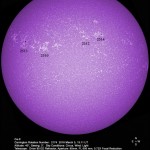
11 Active regions could be observed during the period, which started with four active regions, an active region area total of 210 millionths, as well as 28 sunspots. The largest region was AR2546 which reached its maximum of 540 millionths on May 17th. The shortest lived Active Region was AR2547 with a duration of two days only and did not grow larger than 10 millionths. The active region total for the solar disk maxed out on May 16th at 770 millionths, one day before AR2546 reached its maximum. The highest number of Sunspots (37) could be observed on May 15th.

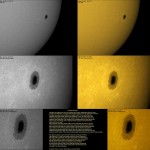
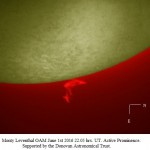
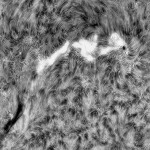
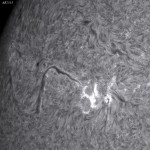
The last 7 days of the Rotation the Sun did not produce any C-class flares, and the last 5 days even went without any B-Class flares, resulting in an overall Very Low solar activity. To top it off, the Rotation ended with three days of no registered active regions or sunspots, a clear indication that we are on the way to the Solar minimum. At the end of the Rotation, observers had submitted 273 observations to the ALPO Solar archive. Thanks to all who observed the Sun for their dedication. Following are a few observations submitted by Tony Broxton, Avani Soares, and Monty Leventhal, but all submitted observations can be seen by following the link above.
The ALPO Solar Team.


April 6, 2016

Carrington Rotation 2174, a short summary


CR2174 ran from 2016-02-18 04:08 UT till 2016-03-16 11:58 UT. We received 222 images/observations for this rotation. This is the first time again since April 2011 that we were able to archive over 200 submissions for one rotation.
http://www.alpo-astronomy.org/gallery/main.php?g2_itemId=79712
The rotation started with a total Active Region Area size of 300 millionths and a Wolf Number of 60. It ended with a total region size of 180 millionths, and a Wolf Number of 57. During the period, the Sun showed 22 Active Regions (AR2497 plus AR2501 – AR2522). The highest total Active Region Areas size was 300 on the first day of the rotation, which was mostly contributed to the size of 220 of AR2497, which was turning that day to the far side of the Sun. For the rest of the rotation, the total areas size maxed out for on February 26, at 260 millionths. The largest region during the rotation except for AR2497, was AR2505 which measured 180 millionths on February 22nd. The daily Wolf number reached its maximum on March 5th at 95, which was mainly caused by an increase of the number of areas for one day, rather than spots. The observations/images below, were submitted by Gabriel Corban, Dave Tyler and Howard Eskildsen.
Thanks to everyone for their contributions to the archive.
The ALPO team


March 27, 2016

ALPOSS – A report on CR2166 thru CR2168


Do you still remember how active the Sun was in the Summer of last year?   ALPOSS Acting Coordinator and Scientific Advisor Richard Hill published his detailed report on Carrington Rotations CR2166 thru CR2168.  The report was published in the 2016 Spring version of the JAPLO and can now also be accessed on ALPOSS’ Solar Observations & Reports page, or by clicking on the following picture:


March 3, 2016

Carrington Rotation 2173, a short summary


Carrington Rotation CR2173 ran from 2016/01/21 19:58 UT until 2016-02-18 04:07.
http://www.alpo-astronomy.org/gallery/main.php?g2_itemId=78586
The rotation started with a total Active Region Area size of 180 and a Wolf Number of 59. It ended with a total region size of 260 millionths, and a Wolf Number of 260. During the period, the Sun showed 17 Active Regions (AR2484 – AR2501). There were 5 days where the total Active Region Areas reached, or exceeded 500 millionths. The rotation maxed out for the total region areas on February 9th, when the daily region area jumped from 460 to 650 millionths and the next day back to 350, mainly because of activity in AR2497. However, AR2497 also managed to produce the largest solar flare of the rotation on February 13th, an M1.8.
A smaller peak in total area of 540 millionths was noticed earlier on January 29th, when the largest sunspot of the rotation, AR2489, covered 300 millionths and registered a Dko on the McIntosh scale. The daily Wolf number reached its very pronounced maximum on February 6th at 113, which was the only day in the rotation where the Wolf number was above 100, but the spot area was only 400. The observations/images below, which were made on some of the key dates, were submitted by Monty Leventhal, Mike Borman and Theo Ramakers.

As of this writing, ALPO received 155 observations/images for the rotation, and we like to thank all that took the time to submit their images/observations.
The ALPO Team.


January 2, 2016

The New ALPOSS Online Archive


As some of you may have noticed, the ALPO Solar Section has a new online archive, where submitted solar observations and images are being kept. They can be accessed by anyone who has an interest in reviewing them. This official ALPO Solar Section Online Archive is not to be confused with the “ALPO Archive” which is graciously maintained separately by the Arkansas Sky Observatory, but is instead the official ALPO archive where members are encouraged to post their images and observations. This ALPO Solar Section Online Archive is also different than the online archives of some other organizations, which are accessible by File Transfer Protocol (ftp) and where images need to be downloaded to be reviewed.

At the current time, the ALPO Solar Section Online Archive houses almost 28,000 images and observations that were submitted by observers and kept in an off-line archive. It is our feeling that in today’s world of social media and fast internet access, we needed to adapt to the new technologies. We have done so with the creation of the ALPO Solar Section Online Archive and letting everyone see what many dedicated observers over the entire world have done to document the activity of the Sun since 1979, which is the earliest image we have in our archive. Please take a look at what’s there at:
http://www.alpo-astronomy.org/gallery/main.php?g2_itemId=1699 .

If you would like your images to be part of the ALPO Solar Section Online Archive and contribute your own observations, please attach your images (which must contain the information requested in the Summary) to an email and send them to solarimages@alpo-astronomy.org.
Or if you are a member of ALPO, you can upload your images directly to the ALPO Solar Section Online Archive, but have to register first by sending an email with your name and intentions to upload observations to the above email address. You will be sent a guide and information on how you can upload the images yourself. We hope that you will enjoy this change as much as we do.
Happy New Year and lots of  Clear Skies,

Theo Ramakers
Acting Assistant Coordinator, the ALPOSS


September 2, 2015

The Carrington event of September2, 1859!

From Spaceweather- September 2nd, 2015

Today is the anniversary of an historic solar storm, the Carrington Event. On Sept. 2, 1859, a CME struck Earth’s magnetic field with such power that telegraph stations caught fire and people in Cuba read their morning newspapers by the red light of the aurora borealis. If a similar storm struck our planet today, it might cause trillions of dollars of damage to society’s high-tech infrastructure. Could the Carrington Event happen again? It almost did just a few years ago. Extreme solar storms–past, present and future–are highlighted on today’s edition of http://spaceweather.com


October 5, 2011

“The Weekly” Preliminary Report and Forecast

The latest version of “The Weekly” Preliminary Report and Forecast of Solar Geophysical Data is now posted on-line and available at http://www.swpc.noaa.gov/weekly/index.html

Older Posts »

   Powered by WordPress     Personalized by: Larry Owens     Contact the Webmaster